Difference between revisions of "Change Log Kalypso 12.11"
Gernotbelger (Talk | contribs) (→Kalypso1D2D) |
(→Kalypso1D2D) |
||
| (32 intermediate revisions by 2 users not shown) | |||
| Line 20: | Line 20: | ||
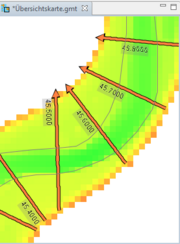
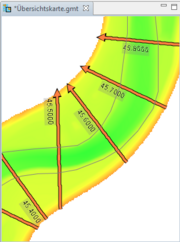
| valign="top" width="50%" | Raster painting has been optimized and can be made even faster by choosing the right options in the user preferences. | | valign="top" width="50%" | Raster painting has been optimized and can be made even faster by choosing the right options in the user preferences. | ||
| [[Image:Change Log 12.11 RasterPainting fast.PNG|thumb|Very fast raster painting using a coarse pixel resolution of 10.]] [[Image:Change Log 12.11 RasterPainting nice.PNG|thumb|Nice but slower raster painting using bilinear interpolation.]] | | [[Image:Change Log 12.11 RasterPainting fast.PNG|thumb|Very fast raster painting using a coarse pixel resolution of 10.]] [[Image:Change Log 12.11 RasterPainting nice.PNG|thumb|Nice but slower raster painting using bilinear interpolation.]] | ||
| + | |- | ||
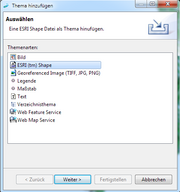
| + | | valign="top" width="50%" | Importing map data into workflow projects has been generalized and improved. Importing map themes (like ESRI Shape, WebMapServer) is now uniformly available in all workflow projects via the map outline (green +). New functions are | ||
| + | <ul> | ||
| + | * the new theme is added at the current selection in the outline, even in sub-themes | ||
| + | * more theme types are available (legend, sub-themes, etc.) | ||
| + | * Shape import now automatically creates a local style definition for the imported shape which can be edited via the style editor. | ||
| + | </ul> | ||
| + | | [[Image:Change_log_12.11_addTheme_options.png|thumb|New and improved layer types of Kalypso]] | ||
| + | |- | ||
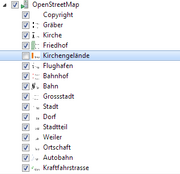
| + | | valign="top" width="50%" | WebMapServers in Kalypso now are shown in the map outline with all wms themes as sub-layers that can be individually switched on/off. If the WMS supports legend icons, they are shown in the legend. | ||
| + | | [[Image:Change_log_12.11_wms_sublayers.png|thumb|Sub-Layers of the OpenStreepMap WMS shown in Kalypso's map outline]] | ||
| + | |- | ||
|} | |} | ||
| Line 35: | Line 47: | ||
{| border="1" cellpadding="10" cellspacing="5" | {| border="1" cellpadding="10" cellspacing="5" | ||
| − | | valign="top" width="50%" | The user interface of KalypsoHydrology has been completely reworked and uses now the workflow approach of Kalypso1D2D, Risk and Flood. Please refer to the new [http://kalypso.bjoernsen.de/manual/ KalypsoHydrology] manual for the new functionality. | + | | valign="top" width="50%" | The user interface of KalypsoHydrology has been completely reworked and uses now the workflow approach of Kalypso1D2D, Risk and Flood. New features include |
| + | * new time-series management based on stations and parameter types | ||
| + | * validation of time-series during import | ||
| + | * support of catchment models to produce simulation time-series (e.g. rainfall). Support for Thiessen and Inverse-Distance Methods. | ||
| + | * data management completely reworked in order to prevent redundant data models | ||
| + | * support for scenario based data management in order to manage various variants of the hydrological model | ||
| + | * creation and management of simulations including start conditions tremendously improved | ||
| + | * new result management for easier comparison of result time-series. | ||
| + | Please refer to the new [http://kalypso.bjoernsen.de/manual/ KalypsoHydrology] manual for the new functionality. | ||
| [[Image:Change_log_12.7_hydrology_reworked.png|thumb|New user interface of KalypsoHydrology]] | | [[Image:Change_log_12.7_hydrology_reworked.png|thumb|New user interface of KalypsoHydrology]] | ||
|- | |- | ||
| Line 71: | Line 91: | ||
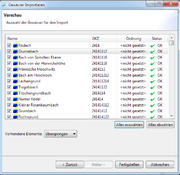
| [[Image:Change_log_12.2_ImportWaterBodiesDialog.png|thumb|Preview of imported water bodies]] | | [[Image:Change_log_12.2_ImportWaterBodiesDialog.png|thumb|Preview of imported water bodies]] | ||
|- | |- | ||
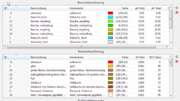
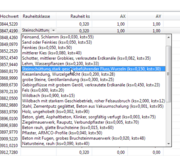
| − | | valign="top" width="50%" | | + | | valign="top" width="50%" | It is now possible to work with roughness (soil and vegetation) ''classes'' instead of values. The classes are defined at a central place in the wspm project. |
| − | | | + | | [[Image:ChangeLog 12.11.0 class definitions.png|thumb|Central definition of roughness and vegetation classes]] |
| + | [[Image:ChangeLog 12.11.0 roughness class assignment.png|thumb|Assigning a roughness class to a profile point]] | ||
|- | |- | ||
| − | | valign="top" width="50%" | new landuse shape file import: import landuse shape files and assign roughness and vegetation classes | + | | valign="top" width="50%" | The old functionality of roughness assignment has been replaced by two new features: |
| − | | | + | * a new landuse shape file import: import landuse shape files into a wspm project and assign roughness and vegetation classes to attributes of the shape file |
| + | * assign landuse to profiles: select a previously imported landuse shape and assign the roughness classes accordingly to it's assignment between shape attributes and roughness classes | ||
| + | the new features works identical for soil and vegetation roughness. | ||
| + | | [[Image:ChangeLog 12.11.0 landuse import.png|thumb|Importing a shape file as landuse and mapping shape attributes to roughness classes]] | ||
| + | [[Image:ChangeLog 12.11.0 landuse assignment.png|thumb|Assigning roughness classes to a profile using a previously imported landuse shape file]] | ||
|- | |- | ||
| valign="top" width="50%" | EXPERIMENTAL: a new tool allows to derive a river line from its cross sections. At the moment, the method simply concatenates the position of each lowest point of each section. | | valign="top" width="50%" | EXPERIMENTAL: a new tool allows to derive a river line from its cross sections. At the moment, the method simply concatenates the position of each lowest point of each section. | ||
| Line 101: | Line 126: | ||
| valign="top" width="50%" | It is now possible to export waterlevel relationships (runoff, area, alpha, etc.), which have been calculated with the calculation option 'steady non-uniform' or 'polynomials', as tabular data (e.g. to excel). | | valign="top" width="50%" | It is now possible to export waterlevel relationships (runoff, area, alpha, etc.), which have been calculated with the calculation option 'steady non-uniform' or 'polynomials', as tabular data (e.g. to excel). | ||
| [[Image:Change log 12 7 Export_Polynomials.png|thumb|Tabular listing of waterlevel related data, enabled for export.]] | | [[Image:Change log 12 7 Export_Polynomials.png|thumb|Tabular listing of waterlevel related data, enabled for export.]] | ||
| + | |- | ||
| + | | valign="top" width="50%" | Cross sections can now be exported into the GAF-Format (Gewässerkundliches Austauschformat, *.gaf). | ||
| + | The exporter creates the main .gaf file as well as some associated files as vegetation classes (.bwp) and roughness classes (.kst). | ||
| + | | | ||
| + | |- | ||
|} | |} | ||
| Line 110: | Line 140: | ||
</ul> | </ul> | ||
| [[Image:Change log 12.7 channel edit.png|thumb|New panel of channel edit tool]] | | [[Image:Change log 12.7 channel edit.png|thumb|New panel of channel edit tool]] | ||
| + | |- | ||
| + | | valign="top" width="50%" | There is a new tool (''Ditch Generator'') for creating a complex system of ditches with trapezoidal geometry from an imported line network (ESRI Shape type LineZ). | ||
| + | The line network is buffered twice at specified distances for each network section to generate the lower and upper bank lines of the ditch system. The resulting bank lines are meshed using a semi-structured triangulation algorithm (requires triangle.exe). The area surrounding the ditch network may, optionally, be included in the triangulation. The bottom elevation is then taken from the line network, while node elevations in the surrounding area and the upper bank line are interpolated from the project's DEM. | ||
| + | | [[Image:Change_log_12.11_ditchgen.png|thumb|Generated ditch network]] | ||
| + | |- | ||
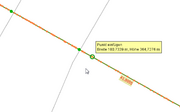
| + | | valign="top" width="50%" | It is now possible to assign a fixed elevation (and comment text) to selected nodes. | ||
| + | | [[Image:Change_log_12.11_assign_elev.png|thumb|Assign elevations]] | ||
|- | |- | ||
| valign="top" width="50%" | The ''Import River Profiles'' workflow point does now enable the user to select a profile format. Next to the Tripple format, the EWAWI+ format is supported. | | valign="top" width="50%" | The ''Import River Profiles'' workflow point does now enable the user to select a profile format. Next to the Tripple format, the EWAWI+ format is supported. | ||
| | | | ||
|- | |- | ||
| − | | valign="top" width="50%" | The simulation log file now shows warnings that occur during | + | | valign="top" width="50%" | The simulation log file now shows warnings that occur during pre-processing data for the simulation with RMA-Kalypso. |
| − | + | Warnings will be given for missing roughness classes, missing node elevation and others. | |
| + | Selection of a warning will zoom the map to the corresponding mesh element. | ||
| + | | [[Image:Change_log_12.11_simulation_log.png|thumb|Simulation log with improved warnings]] | ||
| + | |- | ||
| + | | valign="top" width="50%" | It is now possible to import elements from SMS-Format (*.2dm) and ESRI Shape (*.shp, PolygonZ) into the mesh. Imported elements are shown in a preview window and can be validated. | ||
| + | Shape elements with more than four vertices are automatically triangulated before imported into the mesh. | ||
| + | | [[Image:Change_log_12.11_meshimport_preview.png|thumb|Preview of imported mesh elements]] | ||
| + | [[Image:Change_log_12.11_meshimport_validation.png|thumb|Validation messages for imported mesh elements]] | ||
| + | [[Image:Change_log_12.11_meshimport_result.png|thumb|Freshly imported and triangulated mesh]] | ||
| + | |- | ||
| + | | valign="top" width="50%" | Creation of grid meshes with the band generator has be improved. When the 3rd or 4th side of the grid is entered, it is now possible to directly finish the side by double clicking on the end point of the line. The line will be automatically divided according to its opposite grid side. | ||
| + | | [[Image:Change_log_12.11_bandgenerator_shortcut.png|thumb|Third side of grid before...]] | ||
| + | [[Image:Change_log_12.11_bandgenerator_shortcut_done.png|thumb|and after double-click with automatically inserted vertices.]] | ||
| + | |- | ||
| + | | valign="top" width="50%" | The tool for adding a new continuity line has been improved: | ||
| + | * a preview of the new line is shown while editing | ||
| + | * the tool prevents invalid results and shows validation messages | ||
| + | * the algorithm for automatically connecting two nodes has been improved | ||
| + | | [[Image:Change log 12.11 ContiLineTool preview.png|thumb|Preview while editing new continuity line]] | ||
| + | [[Image:Change log 12.11 ContiLineTool validation.png|thumb|Validation message when line is invalid]] | ||
|- | |- | ||
|} | |} | ||
| Line 130: | Line 186: | ||
{| border="1" cellpadding="10" cellspacing="5" | {| border="1" cellpadding="10" cellspacing="5" | ||
| + | | valign="top" width="50%" | See also change log of KalypsoWSPM. Most changes also apply to the cross section database. | ||
| + | | | ||
| + | |- | ||
| valign="top" width="50%" | Import elevation model data from an external data location. This can be done via the ''Manage elevation model'' tool in the map. | | valign="top" width="50%" | Import elevation model data from an external data location. This can be done via the ''Manage elevation model'' tool in the map. | ||
| | | | ||
| Line 136: | Line 195: | ||
| | | | ||
|- | |- | ||
| − | | | + | | valign="top" width="50%" | Waterlevel events can now be associated with states. If this is the case for a waterlevel event, it is shown as sub element of the state in the db viewer. |
| − | + | | [[Image:Change_log_12.11_pdb_subevents.png|thumb|Cross section state with associated water level events]] | |
| − | == | + | |- |
| + | | valign="top" width="50%" | The data model of the database has been completed and is now able to contains all data of a WSPM project. In particular, building properties and profile markers are now preserved when a state is uploaded into the database. | ||
| + | | | ||
| + | |- | ||
| + | | valign="top" width="50%" | It is now possible to attach arbitrary documents to water bodies as well as state, similar to the way documents could be attached to cross sections before. Attached documents are shown in the feature view and can be opened in a browser window. | ||
| + | | | ||
| + | |- | ||
| + | | valign="top" width="50%" | It is now possible to import and display two dimensional water levels. | ||
| + | The water levels are imported from a shape POINTZ file of water level points associated to cross sections via their station, possibly produced by digitizing water level points from a 2d-waterlevel-tin along section lines. | ||
| − | + | When imported, the water levels are simplified, projected into the cross section geometry and intersected with the sections in order to produce water levels segments to be shown in the section viewer. | |
| − | | valign="top" width="50%" | | + | | [[Image:Change log 12.11 pdb 2d waterlevels.png|thumb|2D-water level projected into a cross section]] |
| − | | | + | |- |
| + | | valign="top" width="50%" | WSPM cross sections now support arbitrary additional section objects that can be shown in the section viewer as lines or points.<br/> | ||
| + | This feature is in particular used to show all data imported from external formats like .gaf, that is not otherwise represented in WSPM cross sections. | ||
| + | | [[Image:Change log 12.11 pdb profile parts.png|thumb|Additional line object shown in section viewer]] | ||
| + | [[Image:Change log 12.11 pdb profile parts egg.png|thumb|Additional point objects shown in section viewer]] | ||
|- | |- | ||
|} | |} | ||
Latest revision as of 16:38, 5 February 2013
Changes since: Kalypso-11.6
Contents |
[edit] Kalypso Platform
Items that improve Kalypso in general.
| The tool for selecting features in a map now has a 4th selection mode: 'Hover'. In this mode, the selection follows the mouse cursor without need for a click in the map. | |
| Support for GML 2 has been dropped, Kalypso currently supports GML 3.1. The GML parser has been reworked to use less memory and has less performance impact during startup. | |
| Kalypso now supports the 'M' type of ESRI Shape files (POINTM, POLYLINEM and POLYGONM). The 'M' part is not used or stored in Kalypso, but at least Kalypso is able to read these kind of shape files. | |
| The build process of Kalypso has been optimized to reduce the size of the Kalypso installation by about 40%. | |
| Raster painting has been optimized and can be made even faster by choosing the right options in the user preferences. | |
Importing map data into workflow projects has been generalized and improved. Importing map themes (like ESRI Shape, WebMapServer) is now uniformly available in all workflow projects via the map outline (green +). New functions are
|
|
| WebMapServers in Kalypso now are shown in the map outline with all wms themes as sub-layers that can be individually switched on/off. If the WMS supports legend icons, they are shown in the legend. |
[edit] Consumability / Reliability
Items that make it easier for users to get Kalypso, install it on their systems, and configure it for their use.
| Improved installation process. Separate installers for 32bit and 64bit systems are now available. The data workspace is now saved in the user profile by default. |
[edit] KalypsoHydrology
The user interface of KalypsoHydrology has been completely reworked and uses now the workflow approach of Kalypso1D2D, Risk and Flood. New features include
Please refer to the new KalypsoHydrology manual for the new functionality. |
[edit] KalypsoWSPM
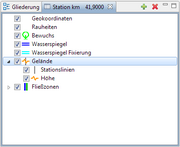
| The cross section legend view now selects the first entry when first shown. It also remembers which layer was shown when the selected cross sections changes. I.e. if the user browses through the cross sections, the legend keeps the selected element. | |
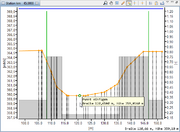
| The current mouse position is now always displayed at the bottom-right of the profile chart. | |
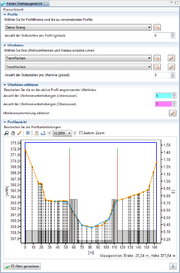
| A new tool allows to interpolate (and extrapolate) missing profile point geometries. | |
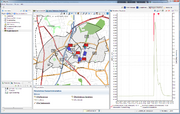
| A new tool in the map allows to interactively select profile points. Either a single position within a profile can be selected, or a range between two positions. The selection is synchronized with the selection of the profile table.
An analogous tool has been implemented for the profile chart. |
|
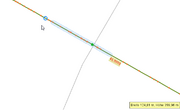
| The map view and chart view now support a profile cursor that shows the current mouse position within a cross section. The cursor can be separately activated and deactivated for each view.
If the cursor is activated in both views, the cursor position is synchronized between the two views, which allows to see the mouse position of the map in the chart view of a cross section. |
|
| Two new tools allow to insert new points into a cross section via the map and the chart. The new point is inserted at the mouse position and its parameters are interpolated from it's neighboring points. | |
| It is now possible to import water bodies from a shape file. The import allows to update existing water bodies as well as to import new ones. The import reads reference number, label, description and rank from the attributes of the shape. In particular, the imports allows to import a center line into the WSPM model. The center line will be basis for a number of future functions of WSPM. | |
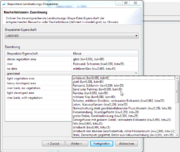
| It is now possible to work with roughness (soil and vegetation) classes instead of values. The classes are defined at a central place in the wspm project. | |
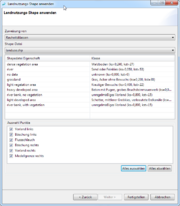
The old functionality of roughness assignment has been replaced by two new features:
the new features works identical for soil and vegetation roughness. |
|
| EXPERIMENTAL: a new tool allows to derive a river line from its cross sections. At the moment, the method simply concatenates the position of each lowest point of each section. | |
| EXPERIMENTAL: a new export method allows to build smooth bank lines from a river line and marker points (e.g. bank full points) of a set of cross sections. This function relies on a new algorithm that builds a geometric buffer with variable distances for each intersection between a cross section and the river line. | |
| The Manage Elevation Model Tool now supports also triangulated data to be imported into the map. This may be a file in the HMO Format, 2DM-Format or an ESRI Shape (PolygonZ) with triangles. | |
| The Straighten Profile tools straightens a profile between two selected points. | |
| The EWAWI+ format is now supported. EWAWI+ profiles can be imported into the model. | |
| The WSPM tree view now shows different symbols for bridges, weirs and culverts. | |
| It is now possible to define additional energy losses on a per profile basis (missing feature from WspWin resp. Kalypso-1D.exe). | |
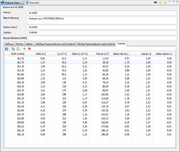
| It is now possible to export waterlevel relationships (runoff, area, alpha, etc.), which have been calculated with the calculation option 'steady non-uniform' or 'polynomials', as tabular data (e.g. to excel). | |
| Cross sections can now be exported into the GAF-Format (Gewässerkundliches Austauschformat, *.gaf).
The exporter creates the main .gaf file as well as some associated files as vegetation classes (.bwp) and roughness classes (.kst). |
[edit] Kalypso1D2D
The channel edit tool has been reworked. New features include:
|
|
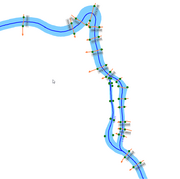
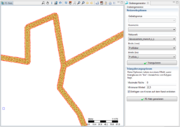
| There is a new tool (Ditch Generator) for creating a complex system of ditches with trapezoidal geometry from an imported line network (ESRI Shape type LineZ).
The line network is buffered twice at specified distances for each network section to generate the lower and upper bank lines of the ditch system. The resulting bank lines are meshed using a semi-structured triangulation algorithm (requires triangle.exe). The area surrounding the ditch network may, optionally, be included in the triangulation. The bottom elevation is then taken from the line network, while node elevations in the surrounding area and the upper bank line are interpolated from the project's DEM. |
|
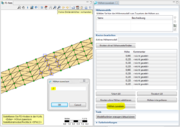
| It is now possible to assign a fixed elevation (and comment text) to selected nodes. | |
| The Import River Profiles workflow point does now enable the user to select a profile format. Next to the Tripple format, the EWAWI+ format is supported. | |
| The simulation log file now shows warnings that occur during pre-processing data for the simulation with RMA-Kalypso.
Warnings will be given for missing roughness classes, missing node elevation and others. Selection of a warning will zoom the map to the corresponding mesh element. |
|
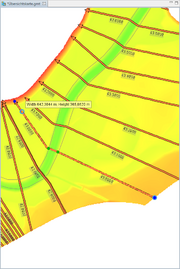
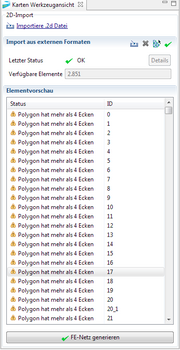
| It is now possible to import elements from SMS-Format (*.2dm) and ESRI Shape (*.shp, PolygonZ) into the mesh. Imported elements are shown in a preview window and can be validated.
Shape elements with more than four vertices are automatically triangulated before imported into the mesh. |
|
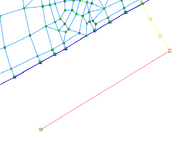
| Creation of grid meshes with the band generator has be improved. When the 3rd or 4th side of the grid is entered, it is now possible to directly finish the side by double clicking on the end point of the line. The line will be automatically divided according to its opposite grid side. | |
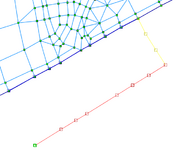
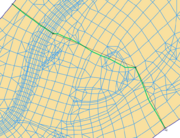
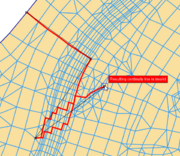
The tool for adding a new continuity line has been improved:
|
[edit] KalypsoRISK
| A new evaluation methods allows to groups the calculated damages by an arbitrary shape file. |
[edit] Cross Section Database
| See also change log of KalypsoWSPM. Most changes also apply to the cross section database. | |
| Import elevation model data from an external data location. This can be done via the Manage elevation model tool in the map. | |
| Export a source file of an elevation model to an external data location. This can be done via the Manage elevation model tool in the map. | |
| Waterlevel events can now be associated with states. If this is the case for a waterlevel event, it is shown as sub element of the state in the db viewer. | |
| The data model of the database has been completed and is now able to contains all data of a WSPM project. In particular, building properties and profile markers are now preserved when a state is uploaded into the database. | |
| It is now possible to attach arbitrary documents to water bodies as well as state, similar to the way documents could be attached to cross sections before. Attached documents are shown in the feature view and can be opened in a browser window. | |
| It is now possible to import and display two dimensional water levels.
The water levels are imported from a shape POINTZ file of water level points associated to cross sections via their station, possibly produced by digitizing water level points from a 2d-waterlevel-tin along section lines. When imported, the water levels are simplified, projected into the cross section geometry and intersected with the sections in order to produce water levels segments to be shown in the section viewer. |
|
| WSPM cross sections now support arbitrary additional section objects that can be shown in the section viewer as lines or points. This feature is in particular used to show all data imported from external formats like .gaf, that is not otherwise represented in WSPM cross sections. |
