Difference between revisions of "Table/TimeSeries/hydrology/en"
From Kalypso
BhawaniRegmi (Talk | contribs) (→Table View of Time Series) |
BhawaniRegmi (Talk | contribs) |
||
| Line 1: | Line 1: | ||
= Table View of Time Series = | = Table View of Time Series = | ||
Time series can be opened using two methods as a data table. First, the time series can be stored externally ([[File:In Grafik-exe öffnen.png]] ''See graphic chart.exe'') using the editor and then be compared. On the other hand, it is also possible to display edit time series from the menu table. | Time series can be opened using two methods as a data table. First, the time series can be stored externally ([[File:In Grafik-exe öffnen.png]] ''See graphic chart.exe'') using the editor and then be compared. On the other hand, it is also possible to display edit time series from the menu table. | ||
| − | |||
<!-- Stimm nicht! | <!-- Stimm nicht! | ||
| − | + | Über den Editor kann per Klick auf [[File:Datenexport.png|20px]] ''Export aller Daten'' die Tabelle mit den in KalypsoHydrology hinterlegten Daten extern als (Text-)Datei gespeichert werden, sodass diese dann eingesehen und ggf. bearbeitet werden kann. | |
--> | --> | ||
| + | [[File:Tabellen Ansicht.png|250px|thumb|Table View]] | ||
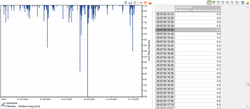
| + | In the ''Properties'' window under the icon [[File:editieren.png]] ''Edit Time Series'', a tabular format appears in KalypsoHydrology (see Figure[[:File:Tabellen Ansicht.png|''Table View'']]) which is displayed next to the chart of the time series data. In this table, values can be selected and displayed in the chart. | ||
| − | |||
| − | |||
[[Category:Hydrology/en]] | [[Category:Hydrology/en]] | ||
Latest revision as of 21:11, 4 January 2017
[edit] Table View of Time Series
Time series can be opened using two methods as a data table. First, the time series can be stored externally (![]() See graphic chart.exe) using the editor and then be compared. On the other hand, it is also possible to display edit time series from the menu table.
See graphic chart.exe) using the editor and then be compared. On the other hand, it is also possible to display edit time series from the menu table.
In the Properties window under the icon ![]() Edit Time Series, a tabular format appears in KalypsoHydrology (see FigureTable View) which is displayed next to the chart of the time series data. In this table, values can be selected and displayed in the chart.
Edit Time Series, a tabular format appears in KalypsoHydrology (see FigureTable View) which is displayed next to the chart of the time series data. In this table, values can be selected and displayed in the chart.
