ParameterDefinitions/TimeSeriesEditor/hydrology/en
From Kalypso
Revision as of 19:00, 23 October 2016 by BhawaniRegmi (Talk | contribs)
Time Series Editor
Chart elements are processed in Kalypso using the Time Series Editor. The processing of the data can be made directly in the table or be imported by the import and export function. Additionally, a diagram view of the data is integrated for data visualization. In KalypsoHydrology the time series editor is used at the following locations:
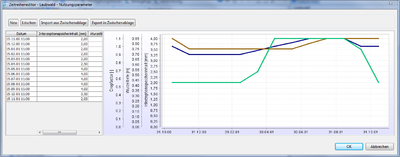
- To modify the usage of parameters of the ideal annual land use (see Figure Time Series Editor Ideal land use parameters)
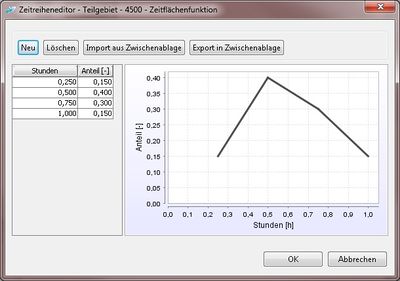
- To define the time area function of sub-catchments (see Figure Time Series Editor Time Area Function),
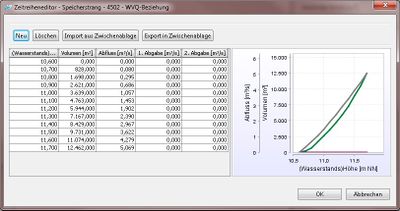
- To modify the parameters of the storage strands (see Figure Time Series Editor Storage Strand) .
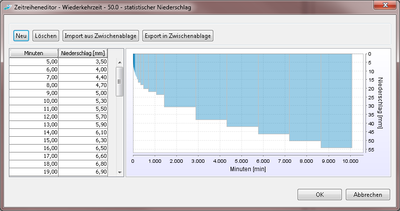
- To modify the Design Storms (see Figure Time Series Editor Design Storms) .
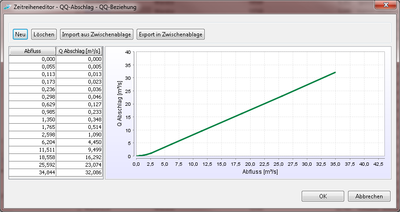
- To modify the Q to Q distribution from nodes (see FigureTime Series Editor for a QtoQ Relationship).
Explanation of each option:
- New: The button “new” enables the creation of new chart data. By the specifications of some data (minimum interval, number of pairs of values and default value), a new chart is first created, which can then be edited in detail in the table. Here, it is important to ensure that the main axis of the diagram in the table cannot be edited. A discontinuous interval is present on the main axis of the diagram, so this chart is created by importing the data from the clipboard.
- Delete: The button “delete” causes the deletion of the values of the current chart element.
- Chart Export / Import from Clipboard: The chart data can be edited directly in the surface or in external programs (for example Excel) and imported by the clipboard. For this purpose, any table has to be newly created, then the data in the external (Excel) table are selected and copied using Ctrl + C in the buffer. This data is then copied by clicking on the button 'Import from buffer' in the created table. This function can also be used in reverse, to transfer data from the Kalypso interface for editing in an external program (Export to clipboard).
| Language: | English • Deutsch |
|---|
