DiagramView/TimeSeries/hydrology/en
Diagram View of Time Series
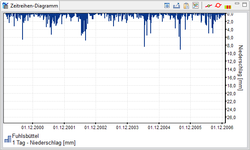
When selecting a time series in the time series management, it automatically displays the diagram view in the window of time series chart (See Figure Diagram View). The diagram is the quick overview and representation of time series. The possibility of time series processing is not provided with the tool. In order to select multiple time series (press and hold CTRL and select time series), and multiple time series are displayed simultaneously in the Time series graph window. It is not necessary, however, that the time series have the same units. If they are different, the units on staggered axes are displayed.
A zoom function is available in the diagram view. In order to represent a portion increase of the time series, the corresponding section has to be highlighted by stretching a rectangle with the left mouse button. After the first corner point (upper left corner) of the window, press and hold the left mouse button at the margins of the fence. To zoom in on the total area of the ![]() Maximieren button must be pressed.
Maximieren button must be pressed.
The button ![]() can be used to Exportthe displayed diagram as an image file. If the chart shall be Copied to the clipboard, the button
can be used to Exportthe displayed diagram as an image file. If the chart shall be Copied to the clipboard, the button ![]() must be pressed. Afterwards, the graphics including the axis and axis labels should be inserted in any other program using (Ctrl + V).
must be pressed. Afterwards, the graphics including the axis and axis labels should be inserted in any other program using (Ctrl + V).
The ![]() Show Chart.exe , can be used to open the chart in an external editor. This is also used in the previous KalypsoHydrology versions. Using this tool, the user can for example select sections accurately and adjust the scale to its intended use.
Show Chart.exe , can be used to open the chart in an external editor. This is also used in the previous KalypsoHydrology versions. Using this tool, the user can for example select sections accurately and adjust the scale to its intended use.
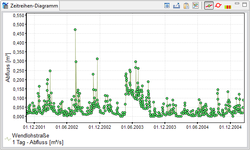
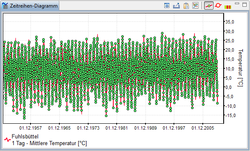
Furthermore, the window displays ![]() which shows “support points”. Support points are the values obtained from the stored table of the diagram. They are presented only for time series data from points (see figure Refrence points for the outflow and Support points for the medium temperature).If the chart above shows the amounts per unit time e.g. evaporation, no change of the display is achieved.
which shows “support points”. Support points are the values obtained from the stored table of the diagram. They are presented only for time series data from points (see figure Refrence points for the outflow and Support points for the medium temperature).If the chart above shows the amounts per unit time e.g. evaporation, no change of the display is achieved.
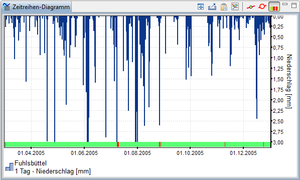
The icon ![]() On screen error values displays possible error values by selecting incorrect values. If false values are displayed, Icon
On screen error values displays possible error values by selecting incorrect values. If false values are displayed, Icon ![]() Error values show-/hide hides sections that are marked, in which missing values in imported series of KalypsoHydrology are automatically added (See Figure On screen error values).
Error values show-/hide hides sections that are marked, in which missing values in imported series of KalypsoHydrology are automatically added (See Figure On screen error values).
Icon ![]() Edit Time Series can be used to edit the time series in a chart format which is shown in the action panel.In the diagram measured values can be selected, which are then displayed in the table and real values can also be read.
Edit Time Series can be used to edit the time series in a chart format which is shown in the action panel.In the diagram measured values can be selected, which are then displayed in the table and real values can also be read.


