Difference between revisions of "ResultView/hydrology/en"
BhawaniRegmi (Talk | contribs) (Created page with "= Result View = == Ansichten zur Ergebnisansicht == Ergebnisansicht Die Ergebnisansicht besteht aus folgenden vier Fenste...") |
BhawaniRegmi (Talk | contribs) |
||
| Line 2: | Line 2: | ||
| − | == | + | == View to see and manage the results == |
| − | [[File:Hydrology_Ergebnisansicht.png|thumb|400px| | + | [[File:Hydrology_Ergebnisansicht.png|thumb|400px|Result View]] |
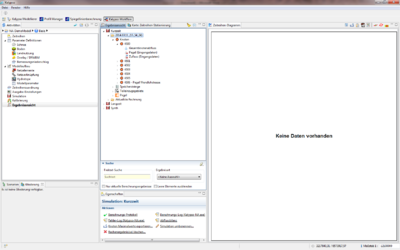
| − | + | The result view consists of the following four windows: | |
| − | ; | + | ; Result view |
| − | : | + | : Results of the simulations are listed in a tree view. |
| − | ; | + | ; Map of Time series stationing |
| − | : | + | : The stations of the time series are shown. |
| − | ; | + | ; Time series charts |
| − | : | + | : Visualization of the imported data. |
| − | ; | + | ; Characteristics |
| − | : | + | : Detailed documentation and log files. |
{{Clear}} | {{Clear}} | ||
| − | == | + | == Results view == |
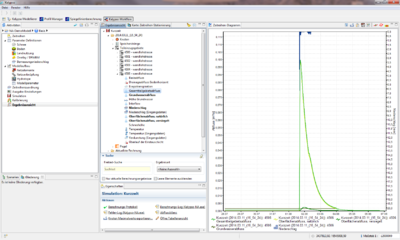
| − | In | + | In the [[:File:Hydrology_Ergebnisansicht.png|''Results view'']], the results of the simulations are listed in a tree view. By opening the tree view of the simulations the results are listed according to the date (see Figure: [[:File:Hydrology_Ergebnisansicht.png|''Result View'']]). The results of the sub-catchments are listed under the point ''Sub-catchments'' that have been selected in the output setting (see Figure: [[:File:Hydrology_Ergebnisansicht_Gebietsmodelle.png|''Result view of the sub-catchments'']]). It is possible that several results (for example, Precipitation, Surface runoff, Total subarea runoff) can be plotted on a graph. For this purpose, the CTRL key is held and the appropriate records can be selected. |
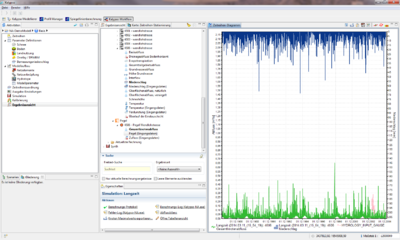
| − | + | For the results of the nodes, the total node outflows are output results (see Figure: [[:File:Hydrology_Ergebnisansicht_Knotenabfluesse.png|''Result view of the node, reservoir strands and gauging stations'']]). If input data of levels or flows may be released to the water node, they will appear in the tree view. With A ''red X'' defines the lack of data. | |
| − | + | For the reservoir strands, the results of the ''Fill volume'', the ''Reservoir overflow'' and ''Evaporation'' are listed. In addition, water level results are listed. | |
| − | + | ||
| − | + | ||
| − | + | ||
| − | + | ||
{| style="margin: 1em auto 1em auto;" | {| style="margin: 1em auto 1em auto;" | ||
| − | | [[File:Hydrology_Ergebnisansicht_Gebietsmodelle.png|thumb|400px| | + | | [[File:Hydrology_Ergebnisansicht_Gebietsmodelle.png|thumb|400px|Results view of the sub catchments]] |
| − | | [[File:Hydrology_Ergebnisansicht_Knotenabfluesse.png|thumb|400px| | + | | [[File:Hydrology_Ergebnisansicht_Knotenabfluesse.png|thumb|400px|Result view of the nodes, reservoir strands and water level]] |
|} | |} | ||
| − | == | + | == Mapping of the Time series stationing == |
| − | [[File:Hydrology_Karte_ZeitreihenStationierung.png|400px|thumb| | + | [[File:Hydrology_Karte_ZeitreihenStationierung.png|400px|thumb|Map of the time series stationing]] |
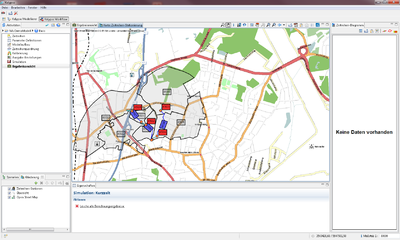
| − | In | + | In the map of the time series stationing, the stations of the time series are shown (see Figure [[:File:Hydrology_Karte_ZeitreihenStationierung.png|''Map of Time series deployment'']]. In the background an Open Street Map map is displayed. Using hydrology map button [[File:Hydrology_Karte_button_Lupe.png]], it can be zoomed into the spanned area of the map. By using [[File:Maximieren.png]], the entire map with the stations is displayed. Zooming into the map is made possible by the hydrology map button [[File:Hydrology_Karte_button_Lupeplusminus.png]] and the section can be moved with the [[:File:Hydrology_Karte_button_schieben.png|''Arrows'']]. The export of the map as an image is made possible by the hydrology map button [[File:Hydrology_Karte_button_export.png]], thereby the dialogue to export images opens (see Figure[[:File:Hydrology_Karte_Bildexport.png|''Image Export'']]). Furthermore, it is possible to save the current map as a PDF file or store it in the clipboard. |
{{Clear}} | {{Clear}} | ||
| − | == | + | == Time Series Chart == |
| − | Die Ansichten der Zeitreihen werden im Zeitreihen-Diagramm erläutert unter [[Zeitreihen/ZeitreihenAnsicht/hydrology/de|'' | + | Die Ansichten der Zeitreihen werden im Zeitreihen-Diagramm erläutert unter [[Zeitreihen/ZeitreihenAnsicht/hydrology/de|''View of the Time Series'']]. |
| − | == | + | == Properties == |
[[File:Hydrology_Ergebnisse_Karte_Eigenschaften.png|thumb|400px|Ergebnisansicht]] | [[File:Hydrology_Ergebnisse_Karte_Eigenschaften.png|thumb|400px|Ergebnisansicht]] | ||
| − | + | Detailed documentation and log files are stored in the [[:File:Hydrology_Ergebnisse_Karte_Eigenschaften.png| ''Properties'']] panel. | |
| − | + | ||
| − | + | ||
| − | + | ||
| − | + | ||
| − | + | ||
| − | + | Information of the simulations can be viewed at the ''Calculation protocol''. The log file of the user is stored under calculation log. This file is written during simulation and gives warnings or error messages by the calculation engine, this can be viewed in the error log for each simulation. | |
| − | + | For the preparation of flood statistics, the maximum flows and the total volume of the discharge curve is stored at the nodes in a table that can be accessed and saved under ''Statistics''. To analyse the of the water balance in the entire catchment area for the event in the short-time simulation or per-year cycle of a long-term simulation, the text document provides ''Outflow'' records. This text file contains the additional storage budgets of interception, the soil water storage and the groundwater aquifer. | |
| + | Using [[File:editieren.png|15px]] the results of the time series can be opened and exported as a table, using (Keyword:[[Ergebnisansicht/Tabellenexport/hydrology/de|''Table Export'']]). | ||
| + | Using Hydrology Map button [[File:Hydrology_Karte_button_export.png]] allows the maximum peak flows of the node (Keyword: [[:Ergebnisansicht/Knoten_Maximalwerte_exportieren/hydrology/de|''Export node maximum values'']]) can be exported. Here, only node results are exported, which was previously selected in the [[:AusgabeEinstellungen/hydrology/de|''Output settings'']]. | ||
[[Category:Hydrology/en]] | [[Category:Hydrology/en]] | ||
{{Languages|Ergebnisansicht/hydrology}} | {{Languages|Ergebnisansicht/hydrology}} | ||
Revision as of 14:26, 18 February 2017
Contents |
Result View
View to see and manage the results
The result view consists of the following four windows:
- Result view
- Results of the simulations are listed in a tree view.
- Map of Time series stationing
- The stations of the time series are shown.
- Time series charts
- Visualization of the imported data.
- Characteristics
- Detailed documentation and log files.
Results view
In the Results view, the results of the simulations are listed in a tree view. By opening the tree view of the simulations the results are listed according to the date (see Figure: Result View). The results of the sub-catchments are listed under the point Sub-catchments that have been selected in the output setting (see Figure: Result view of the sub-catchments). It is possible that several results (for example, Precipitation, Surface runoff, Total subarea runoff) can be plotted on a graph. For this purpose, the CTRL key is held and the appropriate records can be selected. For the results of the nodes, the total node outflows are output results (see Figure: Result view of the node, reservoir strands and gauging stations). If input data of levels or flows may be released to the water node, they will appear in the tree view. With A red X defines the lack of data. For the reservoir strands, the results of the Fill volume, the Reservoir overflow and Evaporation are listed. In addition, water level results are listed.
Mapping of the Time series stationing
In the map of the time series stationing, the stations of the time series are shown (see Figure Map of Time series deployment. In the background an Open Street Map map is displayed. Using hydrology map button ![]() , it can be zoomed into the spanned area of the map. By using
, it can be zoomed into the spanned area of the map. By using ![]() , the entire map with the stations is displayed. Zooming into the map is made possible by the hydrology map button
, the entire map with the stations is displayed. Zooming into the map is made possible by the hydrology map button ![]() and the section can be moved with the Arrows. The export of the map as an image is made possible by the hydrology map button
and the section can be moved with the Arrows. The export of the map as an image is made possible by the hydrology map button ![]() , thereby the dialogue to export images opens (see FigureImage Export). Furthermore, it is possible to save the current map as a PDF file or store it in the clipboard.
, thereby the dialogue to export images opens (see FigureImage Export). Furthermore, it is possible to save the current map as a PDF file or store it in the clipboard.
Time Series Chart
Die Ansichten der Zeitreihen werden im Zeitreihen-Diagramm erläutert unter View of the Time Series.
Properties
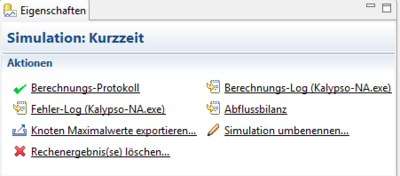
Detailed documentation and log files are stored in the Properties panel.
Information of the simulations can be viewed at the Calculation protocol. The log file of the user is stored under calculation log. This file is written during simulation and gives warnings or error messages by the calculation engine, this can be viewed in the error log for each simulation.
For the preparation of flood statistics, the maximum flows and the total volume of the discharge curve is stored at the nodes in a table that can be accessed and saved under Statistics. To analyse the of the water balance in the entire catchment area for the event in the short-time simulation or per-year cycle of a long-term simulation, the text document provides Outflow records. This text file contains the additional storage budgets of interception, the soil water storage and the groundwater aquifer.
Using ![]() the results of the time series can be opened and exported as a table, using (Keyword:Table Export).
Using Hydrology Map button
the results of the time series can be opened and exported as a table, using (Keyword:Table Export).
Using Hydrology Map button ![]() allows the maximum peak flows of the node (Keyword: Export node maximum values) can be exported. Here, only node results are exported, which was previously selected in the Output settings.
allows the maximum peak flows of the node (Keyword: Export node maximum values) can be exported. Here, only node results are exported, which was previously selected in the Output settings.
| Language: | English • Deutsch |
|---|
