TimeSeries/TimeSeriesProcessing/hydrology/en
Contents |
Time Series Processing
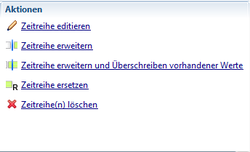
Time series can be edited in the Actions of the Properties field. For doing this, the time series in the tree view of the time series management must be selected (see figureTime Series Processing options).
The following actions are available:
- Edit Time Series
- Extend Time Series
- Extend time series and revise existing values
- Replace Time Series
- Delete Time Series
In addition, the time series in the chart view are represented in Diagram View, which allows a number of further actions. To select another time series in the time series management, multiple time series are represented in the view. This is also possible for time series with different units (precipitation, run off, water level).
Editing Time Series
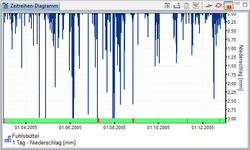
By using the ![]() button Edit Time Series in the action field, time series can be imported and processed. Within the diagram view, the zoom function can be used to edit time series. In order to represent a section of the time series, the corresponding section can be highlighted by stretching a rectangle with the left mouse button. Afterwards, press the first corner point of the section(upper left corner) and hold the left mouse button at the margins of the section.
To zoom on the total area of the
button Edit Time Series in the action field, time series can be imported and processed. Within the diagram view, the zoom function can be used to edit time series. In order to represent a section of the time series, the corresponding section can be highlighted by stretching a rectangle with the left mouse button. Afterwards, press the first corner point of the section(upper left corner) and hold the left mouse button at the margins of the section.
To zoom on the total area of the ![]() Maximieren - button must be pressed.The displayed diagram can be exported as an image file using icon
Maximieren - button must be pressed.The displayed diagram can be exported as an image file using icon ![]() Bild Export. If the chart shall be copied to the clipboard, then the icon
Bild Export. If the chart shall be copied to the clipboard, then the icon ![]() must be pressed to copy the contents of the diagram of the clipboard. Thereafter, the graphics can be inserted including the axes and axis labels in any programme (Ctrl + V).
Furthermore, the points of interaction points can be displayed in the display window of time series
must be pressed to copy the contents of the diagram of the clipboard. Thereafter, the graphics can be inserted including the axes and axis labels in any programme (Ctrl + V).
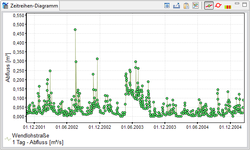
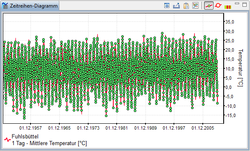
Furthermore, the points of interaction points can be displayed in the display window of time series ![]() . Intersection points are the values obtained from the appearance of the chart from the stored table. They are presented only for time series data from points (see figure Support points for a drain and support points for a medium temperature. If an amount is shown per unit of time (for example, rainfall per day) this data is presented in a bar graph.
. Intersection points are the values obtained from the appearance of the chart from the stored table. They are presented only for time series data from points (see figure Support points for a drain and support points for a medium temperature. If an amount is shown per unit of time (for example, rainfall per day) this data is presented in a bar graph.
By selecting the icon ![]() Show wrong values, possible incorrect values are displayed. Using icon
Show wrong values, possible incorrect values are displayed. Using icon ![]() Hide the sections in which missing values are automatically addedin the time series by KalypsoHydrology (See Figure On Screen Error values).
Hide the sections in which missing values are automatically addedin the time series by KalypsoHydrology (See Figure On Screen Error values).
In time series editor, the databases can be as tables displayed directly.
Edit Table Values
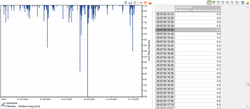
Next to the chart, the values of the time series are displayed as table in the right of the View and can be edited. This helps the users in filling measurement / data gaps when inserting values from external programmes or change the individual measurement error.
| To change a single value or an arbitrary selection, these values must be marked. CTRL helps to highlight a selection of values (hold) + left click on the desired values to highlight single values, or the keyboard shortcut left click on the highest desired value + shift key (press and hold) + left click on the lowest desired value, to mark together a hanging block of values. |
Editing table values in most cases requires the marking of one or more cells. The editing functions are in the form of a context menu by right clicking on the selected value available.
- Setting Values (All)
- All values in a column are replaced with the value of the selected cell.
- Setting values (Selection)
- The values of the selected cells are replaced with the value of the selected cell.
- Setting values (Above)
- All values in the table, which are located above the active cell, are replaced by the value of the selected cell.
- Setting Values (Below)
- All values in the table, which are located below the active cell, are replaced by the value of the selected cell.
- Advanced Editing (Linear Interpolation)
- There is an interpolation of the values between the top-most and bottom-most cell in the selection. (Example: an area is selected by 4 cells.) The value is 7, in the bottom-most cell of 10 in the top cell. The two intermediate cells are provided 8 and 9 with the values).
- Advanced Editing (Customize)
- It opens the wizard tool customization, which allows the values of the selected area being replaced by a constant value, replaced to a fixed value (positive or negative), or the value is multiplied with a specific value or the value can be moved to fixed days and hours.
- Copy
- The selected values in the table are copied to the Clipboard and can be inserted elsewhere. This concerns also the exchange with other programs (E.g. Microsoft Excel).
- Insert
- Values in the Clipboard are inserted at the marked position. The insertion point (top left) is marked by the active cell.
Extending Time Series
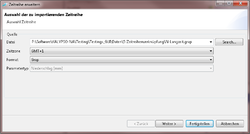
Use ![]() Extend Time Series in the time series box, to expand the actions of imported time series. When selecting the appropriate time series in the time series management, the action extend time series dialogue box opens for selecting the time series to be imported.
Extend Time Series in the time series box, to expand the actions of imported time series. When selecting the appropriate time series in the time series management, the action extend time series dialogue box opens for selecting the time series to be imported.
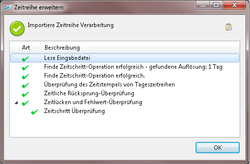
The selected parameter type is already preset according to the extended time series. An adjustment to the time zone by the import and the file format must be selected. With next ![]() , the characteristics of the time series to expand can be adapted to include a description of the extension. After
, the characteristics of the time series to expand can be adapted to include a description of the extension. After ![]() , a log of the time series extension will be available. Import time series processing). By using this function, the time series are expanded without overwriting any existing values.
, a log of the time series extension will be available. Import time series processing). By using this function, the time series are expanded without overwriting any existing values.
Extend time series and overwriting existing values
Use ![]() in the time series box, to expand and overwrite existing values in the action panel of the imported time series. When selecting the appropriate time series in the time series management, the action extends and overwrites existing values and the dialogue box opens for Selecting the time series to be imported.
in the time series box, to expand and overwrite existing values in the action panel of the imported time series. When selecting the appropriate time series in the time series management, the action extends and overwrites existing values and the dialogue box opens for Selecting the time series to be imported.
The selected parameter type is already pre-set according to the time series to be extended. An adjustment to the time zone by the import and the file format must be selected. With ![]() (next Button.jpg), the characteristics of the time series to be expanded can be adapted to include a description of the extension. After
(next Button.jpg), the characteristics of the time series to be expanded can be adapted to include a description of the extension. After ![]() , a log of the time series extension will be available.
Import Time series processing).
Using this function the time series are extended and existing values are overwritten.
, a log of the time series extension will be available.
Import Time series processing).
Using this function the time series are extended and existing values are overwritten.
Replacing Time Series
Use Replace time series icon ![]() to replace field actions in time series. In selecting the appropriate time series in the time series management, the action Replace time series dialogue box opens Replace Time Series to select the imported time series.
to replace field actions in time series. In selecting the appropriate time series in the time series management, the action Replace time series dialogue box opens Replace Time Series to select the imported time series.
The selected parameter type is already pre-set according to the time series to be extended. An adjustment to the time zone can be done by the import and the file format must be selected. With ![]() , the characteristics of the time series to be extended can be adapted to include a description of the extension. After
, the characteristics of the time series to be extended can be adapted to include a description of the extension. After ![]() , a log of the time series extension will be available.
Import Time series processing). This function replaces the existing time series.
, a log of the time series extension will be available.
Import Time series processing). This function replaces the existing time series.
Deleting Time Series
Use delete time series button ![]() in the action field to Delete the Time Series. When selecting the time series management, the action delete time series opens the dialogue box to delete the file.
in the action field to Delete the Time Series. When selecting the time series management, the action delete time series opens the dialogue box to delete the file.
| Language: | English • Deutsch |
|---|
